Brucella
Table 1 Prevalence of Brucella across bovine, ovine and caprine herds.
| Matrix | Total number of herd | Number of infected herds | Number of herds with status officially free |
|---|---|---|---|
| Cattle | 107621 | 0 | 107621 |
| Ovine and caprine | 50983 | 0 | 50983 |
Table 2 Prevalence of Brucella across different species of animals.
| Sampling strategy | Sample stage | Animal | Total number of animals tested | Samples positive | Percentage positive % |
|---|---|---|---|---|---|
| Objective sampling | Official | Bovine | 1275 | 0 | 0 |
| Horses | 3 | 0 | 0 | ||
| Monkey | 1 | 0 | 0 | ||
| Ovine | 3 | 0 | 0 |
Campylobacter
Table 3 Prevalence of Campylobacter across different species of animals.
| Sampling Strategy | Sample Stage | Animal | Total no. of animals tested | Samples Positive | % Positive |
|---|---|---|---|---|---|
| Objective sampling | Official | Alpaca | 3 | 0 | 0.0 |
| Calves under 1 year | 1511 | 87 | 5.8 | ||
| Cervine | 1 | 0 | 0.0 | ||
| Curlew | 1 | 1 | 100.0 | ||
| Dairy cows | 9 | 0 | 0.0 | ||
| Dogs | 23 | 3 | 13.0 | ||
| Fattening pigs | 18 | 0 | 0.0 | ||
| Goats | 13 | 0 | 0.0 | ||
| Horses | 1 | 0 | 0.0 | ||
| Sheep | 582 | 36 | 6.2 |
Coxiella
Table 4 Prevalence of Coxiella across different species of animals.
| Sampling strategy | Sample stage | Animal | Total number of animals tested | Samples positive | Percentage positive % |
|---|---|---|---|---|---|
| Objective sampling | Official | Alpaca | 3 | 0 | 0.0 |
| Calves | 64 | 0 | 0.0 | ||
| Cervine | 1 | 0 | 0.0 | ||
| Dairy cows | 1007 | 53 | 5.3 | ||
| Horses | 1 | 0 | 0.0 | ||
| Milk goats | 5 | 0 | 0.0 | ||
| Porcine | 1 | 0 | 0.0 | ||
| Sheep | 190 | 2 | 1.1 | ||
| Suspect sampling | Private | Drill monkey-wild/zoo animal | 1 | 0 | 0.0 |
Listeria monocytogenes
Table 5 Prevalence of Listeria monocytogenes across different species of animals.
| Sampling strategy | Sample stage | Animal | Total number of animals tested | Samples positive | Percentage positive % |
|---|---|---|---|---|---|
| Objective sampling | Official | Cattle | 3142 | 41 | 1.3 |
| Sheep | 1401 | 10 | 0 |
Mycobacterium
Table 6 Prevalence of mycobacterium across bovine herds.
| Animal | Total number of herds | Number of infected herds | Number of herds with status officially free |
|---|---|---|---|
| Cattle | 107621 | 5172 | 104373 |
Table 7 Prevalence of mycobacterium across different species of animals.
| Sampling strategy | Sample stage | Animal | Total number of animals tested | Samples positive | Percentage positive % |
|---|---|---|---|---|---|
| Objective sampling | Official | Badgers | 1137 | 562 | 49.4 |
| Fox | 1 | 0 | 0.0 | ||
| Goats | 31 | 21 | 67.7 | ||
| Hen | 2 | 0 | 0.0 | ||
| Pigs | 8 | 1 | 12.5 | ||
| Wild deer | 122 | 56 | 45.9 | ||
| Suspect sampling | Private | Alpaca | 86 | 62 | 72.1 |
| Cat | 1 | 0 | 0.0 | ||
| Elephant | 36 | 3 | 8.3 | ||
| Mara | 2 | 0 | 0.0 | ||
| Sheep | 1 | 0 | 0.0 | ||
| Wild bird(raven) | 1 | 0 | 0.0 |
Salmonella in animals
Table 8 Prevalence of Salmonella across different species of animals.
| Sampling Strategy | Sample Stage | Animal | Total no. of animals tested | Samples Positive | % Positive |
|---|---|---|---|---|---|
| Objective sampling | Official | Aborted calves | 1286 | 38 | 3.0 |
| Adult cattle over 2 years | 237 | 3 | 1.3 | ||
| Badgers | 1 | 0 | 0.0 | ||
| Broiler | 116 | 0 | 0.0 | ||
| Calves under 1 year | 1330 | 6 | 0.5 | ||
| Captive birds | 20 | 0 | 0.0 | ||
| Cervine | 11 | 0 | 0.0 | ||
| Dog | 1 | 0 | 0.0 | ||
| Duck | 46 | 2 | 4.3 | ||
| Goats | 17 | 0 | 0.0 | ||
| Goose | 8 | 0 | 0.0 | ||
| Hen | 98 | 0 | 0.0 | ||
| Lagomorph | 3 | 0 | 0.0 | ||
| Pheasant | 12 | 0 | 0.0 | ||
| Pigeon | 1 | 0 | 0.0 | ||
| Pigs | 643 | 2 | 0.3 | ||
| Pullets | 2 | 0 | 0.0 | ||
| Rooster | 2 | 0 | 0.0 | ||
| Sheep | 963 | 6 | 0.6 | ||
| Swan | 5 | 0 | 0.0 | ||
| Table egg layer | 61 | 0 | 0.0 | ||
| Turkey | 30 | 0 | 0.0 | ||
| Unspecified exotic animal | 12 | 0 | 0.0 | ||
| Vulpine | 1 | 0 | 0.0 | ||
| Suspect sampling | Private | Flamingo | 7 | 0 | 0.0 |
| Penguin | 4 | 0 | 0.0 |
Salmonella in animal feed
Table 9 Prevalence of Salmonella across different type of animal feed materials.
| Type of feed material | Tested | Positive | % Positive |
|---|---|---|---|
| Compound feedingstuffs | 208 | 0 | 0 |
| Feed material of cereal grain origin | 95 | 0 | 0 |
| Feed material of land animal origin | 17 | 0 | 0 |
| Feed material of marine animal origin | 2 | 0 | 0 |
| Feed material of oil seed or fruit origin | 114 | 0 | 0 |
| Other feed material | 37 | 0 | 0 |
| Pet food - final product | 11 | 0 | 0 |
Salmonella serovars
Figure 1 Prevalence of Salmonella serovars in various animal species.
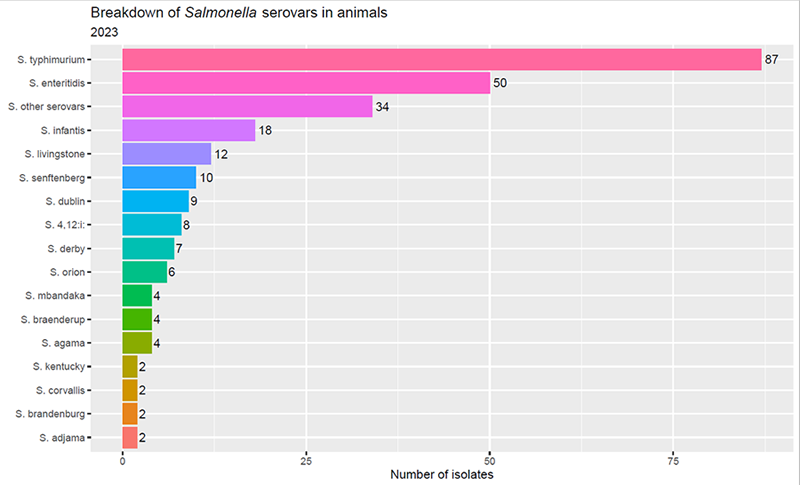
Figure 2 Sankey diagram depicting the prevalence of Salmonella serovars in various animal species.
Toxoplasma
Table 10 Prevalence of Toxoplasma across different species of animals.
| Sampling strategy | Sample stage | Animal | Total number of animals tested | Samples positive | Percentage positive % |
|---|---|---|---|---|---|
| Objective sampling | Official | Goats | 3 | 0 | 0.0 |
| Sheep | 276 | 50 | 18.1 |
Trichinella
Table 11 Prevalence of Trichinella across different species of animals.
| Sampling strategy | Sample stage | Animal | Total number of animals tested | Samples positive | Percentage positive % |
|---|---|---|---|---|---|
| Objective sampling | Official | Horses | 60 | 0 | 0 |
| Pigs | 1384 | 0 | 0 | ||
| Private | Horses | 1977 | 0 | 0 | |
| Pigs | 3310897 | 0 | 0 |
Yersinia
Table 12 Prevalence of Yersinia across different species of animals.
| Sampling strategy | Sample stage | Animal | Total number of animals tested | Samples positive | Percentage positive % |
|---|---|---|---|---|---|
| Objective sampling | Official | Badger | 1 | 0 | 0.0 |
| Buffalo | 2 | 0 | 0.0 | ||
| Cat | 1 | 0 | 0.0 | ||
| Cattle | 3609 | 6 | 0.2 | ||
| Cheetah | 1 | 0 | 0.0 | ||
| Dog | 2 | 0 | 0.0 | ||
| Exotic-alpaca | 12 | 0 | 0.0 | ||
| Exotic unspecified | 16 | 0 | 0.0 | ||
| Fox | 1 | 1 | 100.0 | ||
| Goats | 40 | 0 | 0.0 | ||
| Lagomorph | 5 | 0 | 0.0 | ||
| Porcine | 35 | 0 | 0.0 | ||
| Porcine-fattening pig | 258 | 1 | 0.4 | ||
| Sheep | 1591 | 0 | 0.0 | ||
| Wild deer | 10 | 0 | 0.0 | ||
| Suspect sampling | Private | Dolphin | 1 | 0 | 0.0 |
| Seal | 1 | 0 | 0.0 | ||
| Tiger | 1 | 0 | 0.0 | ||
| Whale | 1 | 0 | 0.0 |